Introduction to Tolerance in Geomet
In this page we will discuss the following topics
Before we discuss how Geomet applies tolerance to a feature, it is useful to review the
various reporting formats available. These formats include Linear or True Position
tolerance reported in either Cartesian or Polar formats. All feature locations are
reported against a Datum Frame Reference or PCS (Part Coordinate System). A two dimension
feature will report its location in one PCS base plane. An example would be an XY Point
consisting of a reported value crossing the X-Axis, a Y-Axis referenced to
the origin.
 |
| figure 1, Example of XY Point |
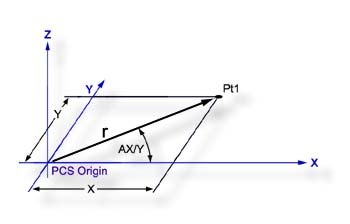
Figure 1 illustrates how the location of a point Pt1, (example
would be a center of a bore) can be expressed in either Cartesian (X,Y) or Polar (r, AX/Y)
coordinates. In the Cartesian format the coordinates X and
Y
are the distances between Pt1 and the origin as measured along the X and
Y axis respectively. In the Polar format, r represents the straight line
distance between Pt1 and the origin, and AX/Y represents
the angle which the line makes with the X axis.
 |
 |
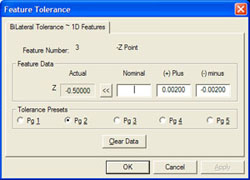
| figure 2, Tolerance 1D Points |
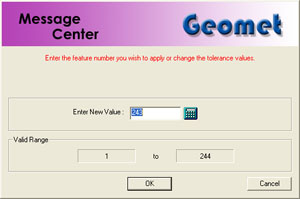
figure 3, Enter Feature Number |
To activate the tolerance tool directly from the displayed report, highlight the
feature by left clicking on it. Activate the feature sub menu by right clicking and select
the "Edit Tolerance" choice. To activate the tolerance tool using keyboard short
keys, press <Ctrl + t> which activates a dialog where the feature number
will be entered, see figure 3. In either method, the appropriate tolerance
dialog is appear with the current tolerance data displayed.
To apply tolerance nominal values, start by entering the nominal value for the reported
feature in the column labeled "Nominal". Next enter the Plus and Minus values
for the bilateral tolerance band.
NOTE: Geomet will assist by entering the sign of the nominal automatically. This is
accomplished by using the sign of the actual reported value which is added to the first
number entered eliminating key strokes.
Additionally, when you enter the plus tolerance band value, Geomet will
automatically add the minus tolerance band value also eliminating extra keystrokes.
In some cases the bilateral tolerance band may not be centered such as
±0.005.
An example might be where the tolerance band is +0.005/-0.002. Enter in the Plus column
"0.005" and in the Minus column "-0.002". The minus sign in the
Minus column must be entered to correctly calculate the actual position within the
tolerance band of +0.005/-0.002. The process of requiring the sign allows tolerance
bands such as +0.010/+0.002, or -0.002/-0.010 which are still in use on assembly drawings.
To apply a Unilateral Tolerance, such as 10.0 +0.01 / 0. enter the 10.0
in the nominal column, 0.01 in the plus column and 0 in the minus column.
To support Limit Dimensioning where the feature has a tolerance using
hard values such as 10.0 / 10.2, we suggest entering either 10.0 +0.02/0 or 10.1 ±0.01.
On every tolerance tool, there exists radio buttons to assign a
Tolerance Preset. It would only be required that the nominal value be entered followed by
the selection of a tolerance preset. For further explanation on tolerance presets, please
refer to System Options. To assign a tolerance preset, press the
<Alt + 2> key combination to assign tolerance preset #2 or left click with
the mouse on the selection.
Not all data fields are required to contain data. If you are required
only to tolerance the X value on a XY Point feature, enter the X nominal and leave the Y
nominal blank. Geomet will then report only the tolerance data on the X axis values.
TIP: It is more efficient to move between edit controls using the tab key or the up
and down arrow keys on the keyboard. The order of movement on the tolerance dialog
utilizing the tab key are: Nominal→Plus→Minus with each press of the
<tab>
key. Should you want to reverse that order, press <Shift + tab>. The
<Enter> key at any time solves the application of the tolerance data and closes the
tolerance tool. To navigate only between the edit controls in the Nominal column, use the
up and down arrow keys. It is not necessary to locate the mouse, which in this case, makes
the tolerance tool very inefficient.
 Is
used to clear all Nominal data from the Tolerance control. Is
used to clear all Nominal data from the Tolerance control.
In addition to the standard tolerance limits assigned,
Geomet can provide additional reporting controls for tighter limits than the
specification. These controls are called Process Control Tolerance (PCT) and
allow application of multiple limits. The use of this tool provides
manufacturing with a early warning system to identify production that may be
closing in on the limits established by the customer. To review PCT and how
it is applied, click here.
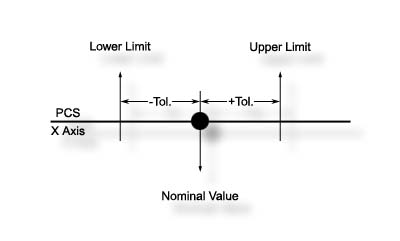
The purpose of measurement is to determine the location and size of
features relative to their specific upper and lower tolerance limits. The space between these limits is
called the Tolerance Zone.
Linear tolerance is sometimes referred to as Unilateral or Bilateral tolerance.
Typical linear tolerance call outs are shown in figure 4.
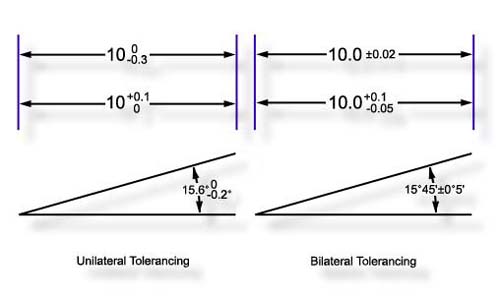 |
| figure 4, Plus and Minus
Tolerance |
The shape of a linear tolerance zone depends on the dimensionality of the
feature in question and on whether the reporting format is Cartesian or Polar. Figures
5
and 6 demonstrate a Bilateral tolerance zone for a one dimensional and two dimensional
feature reported in Cartesian format. Figure 7 demonstrates the tolerance zone of a 2D
feature in polar format. A 3 dimensional feature will have a cubic tolerance zone
surrounding the XYZ nominal point.
 |
| figure 5, 1D Bilateral Tolerance |
|
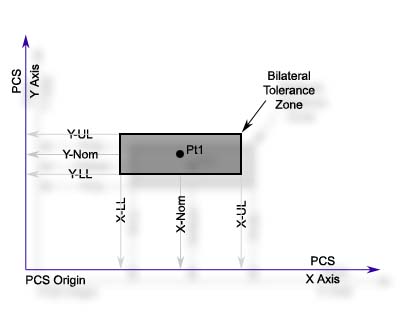 |
| figure 6, 2D Bilateral Tolerance |
|
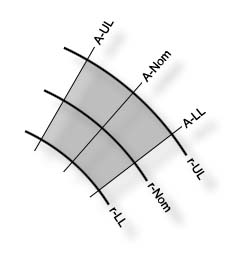 |
| figure 7, Bilateral Tolerance in Polar format |
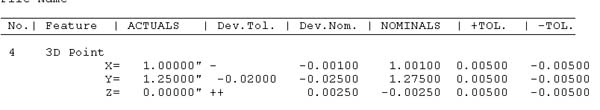
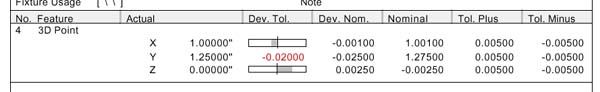
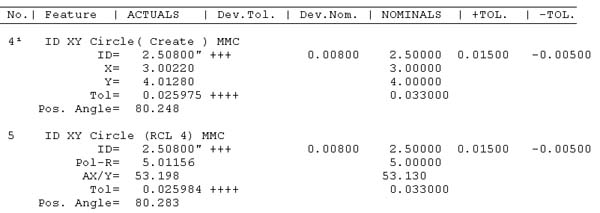
Using a 3D Point as an example, figure 9 demonstrates what Geomet reports
on the computer display and figure 9 the printed result. Please pay special attention to manner
in which "Dev. Tol." (Deviation from Tolerance) is expressed. Geomet displays an
actual deviation value when an out-of-tolerance condition exists. This number is the
actual deviation from the upper or lower tolerance limit. By contrast, plus and minus
symbols are used to indicate an "In tolerance" condition and simultaneously
provide a measure of tolerance bandwidth utilization. In particular, each plus or minus
sign represents 25% of the upper or lower tolerance bandwidth respectively.
 |
| figure 8, Geomet Report Display |
|
 |
| figure 9, Geomet Printed Report |
The following table illustrates examples of the Dev. Tol. column with symbols and
out-of-tolerance conditions
| + |
the actual lies between 0 and 25% of the plus tolerance bandwidth. |
| -- |
the actual lies between >25% and <= 50% of the minus tolerance
bandwidth. |
| +++ |
the actual lies between > 50% and <= 75 % of the plus tolerance
bandwidth. |
| 0.0055 |
the upper tolerance limit has been exceed by 0.0055. |
| table 1, Dev.Tol.
examples |
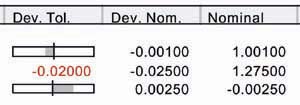
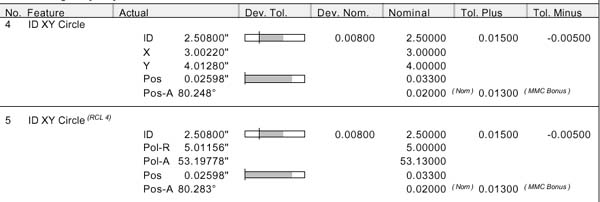
When Geomet prints a report, the "Dev. Tol." column provides a scalable graph
which represents the location within the tolerance bandwidth that the actual is placed,
see
figure 10.
 |
| figure 10, Dev. Tol Printed Examples |
When an out-of-tolerance condition exists, the "Dev. Tol" column prints
a values which represents the deviation from either the plus or minus limit. The
"Dev. Tol." graph is available by default on all printed reports. Should you
elect to always display the deviation value, the setting can be found in [System Options→Report Config] page.
Geomet provides True Position tolerance support for qualifying features in RFS, MMC and
LMC formats. Additionally, Datum Bonus Tolerance is available when building a datum Frame
Reference (PCS) using a bore and a origin feature.
Definitions for most functions can be found in the ASME y14.5M-xxxx specification. The
manual is provided by ASME and can be found on their web site
here.
The Linear tolerance zones previously discussed were found to have widely varying
shapes depending on the print-out format, Cartesian or Polar and on the 1, 2 or 3
dimensional nature of the feature. Positional Tolerance Zones are much simpler by
comparison being either circular, cylindrical, spherical or conical in shape.
In Geomet, Positional Tolerance is limited to circular and spherical zones only and
operates on the following features:
| |
1D Point |
2D Point |
3D Point |
Circle |
Line |
Plane |
Sphere |
Cylinder |
Cone |
| Pos. Tol. |
|
X |
X |
X |
|
|
X |
1 |
1 |
|
Notes:
1 - Positional Tolerance is applied to the 2D Pierce Point only. |
| table
2 ,Origin based on a single
feature |
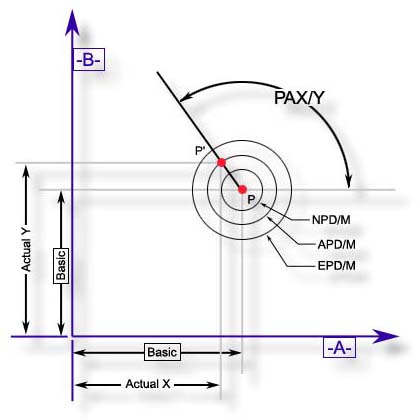
A typical MMC positional tolerance zone, greatly magnified, is shown in figure 11
followed by a definition of terms:
 |
| figure 11, MMC Positional Tolerance Zone |
|
Positional Zone Definitions |
| P |
Nominal Point Location |
| P' |
Actual Point Location |
| NPD/M |
Nominal Position Diameter MMC |
| EPD/M |
Effective Position Diameter MMC |
| APD/M |
Actual Position Diameter MMC |
| PAX/Y |
Position Angle relative to the X axis in the XY
plane. |
| table 3, Positional
Zone Definitions |
whereby the Effective position diameter (EPD/M) is the sum of the Nominal position
diameter (NPD/M) and the tolerance bonus from the measured feature.
In this example, the feature is obviously in tolerance, because the actual position
diameter (APD/M) is less than the Effective position diameter (EPD/M).
Note that the Position angle (PAX/Y) records the direction in which the actual point is
offset relative to the nominal point. The APD/M and the PAX/Y completely define the
location of the actual point. A typical positional tolerance print-out for a Circle is
shown in figures 12 and 13.
 |
| figure 12, Geomet Display of Positional
Tolerance |
|
 |
| figure 13, Geomet Printed Results of Positional
Tolerance |
Geomet calculates all results using the full decimal
point precision allowed. This far exceeds the decimal place setting of
values placed in reports or exported into data files.
When you transfer position values and recalculate
results, such as True Position, you can encounter differences. For
example, if your 2D XY circle was reported at:
| Full
Precision |
Geomet Report Output using a 4 decimal place
setting |
|
X |
Y |
True Pos |
X |
Y |
True Pos |
| 0.000049 |
0.000049 |
0.000069 |
0.0000 |
0.0000 |
0.0001 |
| |
|
|
|
|
|
As you can see, there is a discrepancy in the reported
results. Furthermore, if you manually copied the reported values into a
spreadsheet or calculator, the entered XY values are X= 0.0000 and Y=
0.0000 which results in a solution of 0.0000 using the standard formula:
√(x2 + y2).
To eliminate these rounding, or visual discrepancy, we
recommend to increase the decimal point precision in the report for that
feature by 1. Another option, but not recommended, is to
limit Geomet to calculate only on the report decimal place depth. This
can be done by removing the default check in
System Options->Enhance Features
at:
Full Prec. GDT Calculations
NOTE: limiting the precision depth on reported
tolerance calculations is not recommended. By limiting the precision
depth on calculation does not affect feature measurements, PCS
components or any other calculation that can cause undesirable results.
It only affects the calculations of tolerance reporting.
Datum Bonus Tolerance, (DBT) is available in a Part Coordinate System that has been
built using a diameter as the origin. The DBT process will determine the amount of MMC or
LMC available from the measurement of the diameter. This DBT value is then included
when positional tolerance related features.
For a detailed explanation of DBT, please visit the
Datum Bonus Tolerance Tutorial.
Determining DBT
To determine the value of DBT available in Geomet it is mandatory to follow these
steps. Our example will use a 2D XY bore as the origin for our PCS being built. Measure
the bore as a Circle and apply a tolerance to the size. By applying the tolerance, Geomet
can then determine the LMC or MMC value from the known tolerance limits.
When the tolerance has been applied, press the Origin key, <l> or the menu
[PCS→Origin]. Set the origin on both the X and Y directions. During the origin
process, Geomet will assign the DBT value to the projection plane, in our case the XY
plane.
Applying DBT
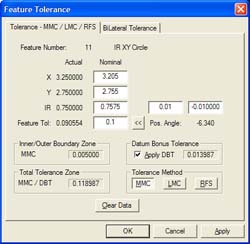 |
| figure 14, Applying DBT |
Applying DBT to a qualifying feature is accomplished during the tolerance process. As
shown in figure 14, the value of DBT is displayed in the group titled "Datum Bonus
Tolerance". Place a check next to the "Apply DBT" and the Total Tolerance
Zone will update with the new value. In this example, the measured circle has a total
tolerance zone of 0.035" which consists of the Feature Tolerance + MMC + DBT.
|