|
Introduction
As the name implies, Process Control Tolerance (PCT)
is a form of controlling manufacturing processes by monitoring production
and automatically reporting conditions that require correction of the
process before non-compliance issues arise. Traditionally a
feature attribute has a single tolerance value that, when exceeded, was
reported only as non-conforming. By the time a non-conformance had been
identified, the manufacturing process may have produced parts that may now
require expensive repairs.
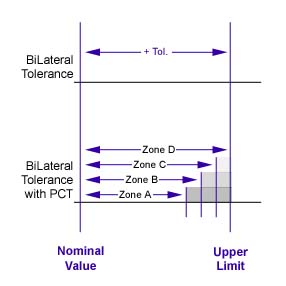 |
| figure
1, PCT Tolerance Zones |
Using PCT allows the inspector to establish different but simultaneous
tolerance zones for position and size of features. For example the size of a
bore might be specified as 1.000 +/- .001. Under PCT controls the controls
values might look like:
Nominal [Zone A] /
[Zone B] / [Zone C] / [Zone D]
-or-
1.000 [+/-.0007] / [+/-.0008] / [+/-.0009]
/ [+/-.001]
As shown in figure 1, We break down the tolerance band
into zones of control. Each zone is identified by Geomet as Zone A / Zone B
/ Zone C and Zone D.
Tolerance Zone Description
The actions required for each tolerance zone is
defined by your companies quality procedure. The zone description below are
suggestions only.
Zone A: This portion of the tolerance zone is
considered in compliance and requires no action. The default value for this
zone is 70% of the allowable tolerance, but may be changed to any desirable
percent of tolerance.
Zone B: Is the portion of the tolerance
zone that exceeds the limit established by Zone A. It is monitored as a
first response to provide corrective action to bring the production process
back under the trigger limit. Production is still within tolerance limits.
The default limit of this zone is 70% - 80% of the allowable tolerance zone.
Zone C: This portion of the tolerance zone
requires immediate action to correct a potential production problem. The
production is still within the tolerance limit, but beyond a trigger zone
that requires immediate attention. The default limit for this value is 80% -
90% of the allowable tolerance zone.
Zone D: This level equals 90% of the allowable
tolerance zone and identifies the production as non-conforming that requires
a material review.
|
Zone |
Suggested Action |
A
B
C
D |
No action required.
Notify Manufacturing and monitor.
Notify Manufacturing and review
process.
Notify Management and adjust
process. |
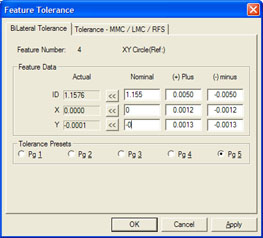
Applying PCT to a Feature
You access the PCT dialog when you apply standard
tolerance from within Geomet. In figure 2, the toleranced feature is a
standard ID XY Circle. The tolerance box will have buttons labeled as
 next to
the Actual value. This is the button used to start the PCT dialog. next to
the Actual value. This is the button used to start the PCT dialog.
 |
 |
| figure 2,
Tolerance Dialog |
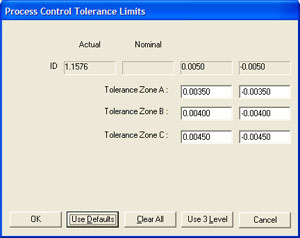
figure 3,
PCT Dialog |
Process Control Tolerance Application Screen
Each zone can be edited with a custom value or the <Use Default> button
can be selected to use the predefined percentages for each zone,
see System Options. There
exists a validation to exit this dialog, where
the zones must be A < B < C <= D to prevent zone
overlapping.
If you require a tighter control, select <Use 3 Level> which will
compress the allowable tolerance limit by eliminating Zone C and defining it
as the non-conformance limit. This will have the same effect as removing the
first notification level when the trigger value has been exceeded.
Reporting of Process Control Tolerance
When a feature is being reported, the Dev. Tol. column
will indicate which zone the results fall within. When a value is in Zone B
you will see a number representing the amount beyond the trigger value. If
in Zone C then the value will be tagged with a symbol: <. If the value is in
Zone D, then the symbol is: << and special care should be taken to segregate
the production.
| Nominal Value |
Reported Value |
Deviation |
PCT Symbol |
Zone A |
Zone B |
Zone C |
Zone D |
|
PCT Reported Symbol by Zone |
|
none |
< |
<< |
Standard OOT Reporting |
| 2.1036 |
2.1000 |
0.0036 |
|
+/-0.0035 |
+/-0.0040 |
+/-0.0045 |
+/-0.0050 |
| 1.0141 |
1.0100 |
0.0041 |
< |
+/-0.0035 |
+/-0.0040 |
+/-0.0045 |
+/-0.0050 |
| 1.0046 |
1.0000 |
0.00046 |
<< |
+/-0.0035 |
+/-0.0040 |
+/-0.0045 |
+/-0.0050 |
| |
|
|
|
|
|
|
|
|
 |
|
Example of a Geomet Report using
PCT |
In the footer of the report, there will be an assigned
classification showing a large letter corresponding to the maximum zone
reached. There will also be a summary line listing the total count of all
attributes that have PCT applied. The summary line will report: Total
Inspected count followed by a count for each zone.
 |
| PCT Summary Report |
The printing of the summary line can be toggled between printing and not
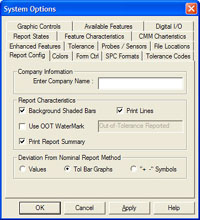
printed by accessing the Report Config tab in System Options,
see System Options
for a complete description.
To print, place a check next to Print Report Summary.
|