|
Introduction
A Cardinal Spline is a series of individual curves
between points joined to form a larger curve. The spline is specified by an array of
points and a tension parameter. A Cardinal
Spline passes smoothly through each point in
the array; there are no sharp corners and no abrupt changes in the tightness of the curve.
By passing through every point, there are no missed points that can cause errors when
fitting a surface over the splines.
The tension of a Cardinal Spline determines the fitting of each curve section in
regards to the data points. The range for the tension value is 0.0 to 1.0 where 1.0 would
deliver straight lines between the data points and 0.0 would produce the most flexible
curves fitted through each data point.
Starting the Cardinal Spline Tool
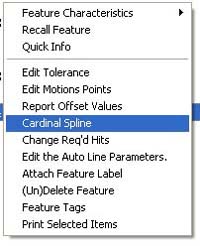 |
| figure 1, Activating |
The Cardinal Spline feature works on data clouds captured through the
various scanning methods available in Geomet. To activate the feature,
locate a data cloud feature in the inspection
report and highlight it through the left click of the mouse. Then right
click to bring up the sub menu. Locate [Cardinal Spline],
see
figure 1.
When activating the Cardinal Spline tool,
Geomet will locate all data cloud features in you current inspection and
display them in the tool. The Cardinal Spline tool will update all features
that you select in one operation. In figure 2, we show that two features,
number 4 and 6, will be updated.
Setting the Cardinal Spline Parameters
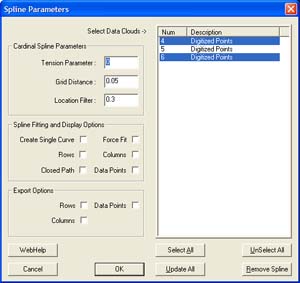 |
| figure 2,
Cardinal Spline Setup
Tool |
There are three parameters used to tune the fitting process for splines. These are:
Tension, Grid Distance and Location Filter. Understanding these parameters will greatly
enhance your success in creating splines from data points.
Tension Parameter
This value controls how the spline is fitted between the data points. The valid range
is 0.0 to 1.0 where 0.0 produces the largest radius between data points and 1.0 will
produce straight lines between data points. We recommend that 0.0 be used as a default.
Grid Distance
This is the setting used when the original data points were scanned. Geomet carries it
over from the scanning operation. However, on earlier Geomet systems, this value was not
included in the original scan features and should be entered manually.
When applying Cardinal Splines to data clouds that do not conform to a uniform row /
column configuration, undesirable results may occur. In this condition, Geomet allows the
selection of "Create Single Curve" and "Force Fit" which is explained
later in this document.
Location Filter
Geomet starts building rows and columns first by sorting the data points
into row and column order. The location filter is applied when Geomet moves
down a column and ‘looks’ for the next data point. For example: if the
column has a start point with a "Y" value of 1.000", it would look down the
column and expect to find the next point also with a "Y" value near 1.000".
Since scanning operations do not deliver exact position, the data point
under the start point might have a "Y" value of 1.012". The Location Filter
is a factor of the grid distance where 0.15 would yield a search zone of
0.15 * Grid Distance (0.15 * 0.05 = .0075). This value determines the zone
around the original "Y" value of 1.000" and the column sorting would not
include the next point at 1.012.
In data clouds that have well-defined row and column structures, the
Location Filter can be low, such as 0.25. In poorly defined patterns, use a
value between 0.5 and 0.9.
When the value is set too high, the splines created can "jump" to
neighboring points from other columns.
Spline Fitting and Display Options
Under the group designated as "Spline Fitting
and Display Options", you can establish the spline methodology and fitting behaviors.
Create Single Curve
This option will take all your data points without regard to rows and columns and fit
the curves through each point in the same order as the points were captured. This option
is designed to work with data point gathering options such as GeoTracer where you capture
data points in a line with distinct start and finish end points. When this option is
checked, the display and export of one spline for this feature will occur.
Rows / Columns
These selections are available when "Create Single
Curve" is not chosen. They are designed
to work with data points gathered under automatic scanning options in Geomet. These
scanning options capture the data points in organized Row and Column formations that can
be extracted to deliver uniform splines. When selecting Row and/or Columns, Geomet will
attempt to build straight lines in the XY plane of the captured data points. Then rows and
columns are extracted and used to form the splines. It is important that these rows and
columns are organized in controlled positions. See Setup Parameters above.
Force Fit
This option is used with Rows and Columns. When calculating the rows and columns, some
data points might be skipped if they do not fall within the parameter settings. This can
cause a row to contain 2 or more splines. When selecting Force Fit, all data points
identified in the row or column will be used to fit one spline. Another use for Force Fit
is when there were exclusion zones used in data point scanning. This will fit the spline
over the exclusion zone.
Closed Path
When this option is checked, Geomet will attempt to close the path from the last data
point to the first.
Data Point
When selected, this option will display the complete set of data points in addition to
any splines selected for showing.
Export Options
These options, combined with Spline Fitting and Display Options control
the export characteristics. The selections of Row and Column for export are
available when Create Single Curve is NOT selected.
NOTE: selecting Row and Columns in the Display group does not
automatically create exported rows and columns!
NOTE: Cardinal Splines is exported in the IGES format only!
Rows
This selection will create and export splines derived from the data points that conform
to rows. The rows exported are controlled by the selections of Force Fit and Closed Path.
Columns
This selection will create and export splines derived from the data points that conform
to columns. The columns exported are controlled by the selections of Force Fit and Closed
Path.
Data Points
This selection will export the data cloud in addition to any row and column selection
already made.
Executing the Cardinal Spline
Once the settings have all been established, select
<Ok> to commence building the Cardinal Splines. Geomet will build rows and/or
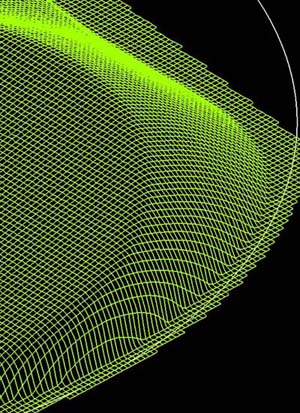
columns of data points and then perform the fitting of the Cardinal Spline. In figure 3, a
raw set of data points that have been captured with Radial Boundary Contour using a grid
spacing of 0.020" is shown. Figure 4 shows the application of Cardinal
Spline.
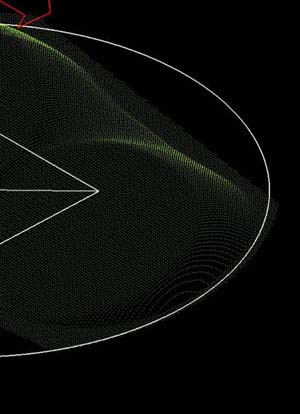 |
 |
| figure 3, Raw Data Points |
figure 4, Applied Cardinal
Splines |
To remove a Cardinal Spline from the data cloud, select <Remove> and the display
will only show the data points.
Related Procedures:
Reverse Engineering Tools, Select Scan
Method,
GeoTracer,
Radial Boundary Scan,
4-Point Boundary Scan, Line Scan,
Export Tool
|