|
Command Activation
| <Alt + Shift + B> |
Analysis→Feature Profiler |
|
| Keyboard |
Main Menu |
Toolbar |
Definition
The Planar Profiler offers the user a visual display
of the data points used in the measurement of a plane. The Profiler can be
used during the capturing of the data, or used as a tool to review the data
points after a plane has been measured.
The resulting display shows the relationship of the
data points localized to the measured plane, or absolute to the Part
Coordinate System.
Activation during the Inspection Process
To view the results of the calculated plane while
capturing data points, start the Planar Profiler, then start the Plane
function. It is suggested that you start the plane function with a large
number of data point such as 999. As you capture data points, the display
will update and the plane results will be displayed.
When you have captured sufficient data points, press
the Terminate function key <F5>.
If you start capturing data points with showing the
Planar Profiler, press <Alt + Shift + B> and the profiler will appear with
the data points already captured.
Reviewing a completed Plane
You can review the profile of a previously measured
plane by highlighting the plane in the report area and then choose one of two
activation methods. In the first method, right click and from the sub menu
that appears, choose "Feature Profiler". The second method uses the main
drop down menus, locate [Analysis→Feature Profiler].
Planar Profiler Display
 |
| figure 1,
Planar Profiler Display |
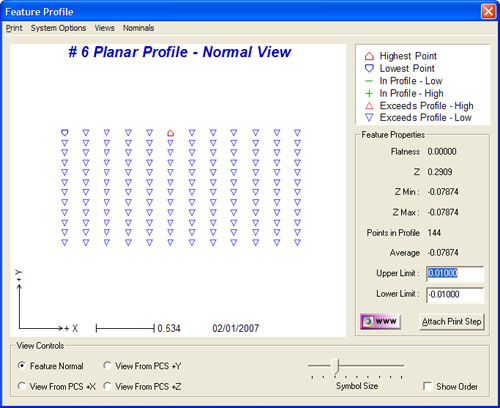
The Planar Profiler Display shows the relative
relationship of the captured data points that were used to fit the reported
Plane feature. In figure 1, we have 8 data points shown in a circular
pattern. Each data point is displayed with a identifying symbol which is
described in the Symbol Legend.
During the actual capturing of the data points, the
display will update with the recalculated information about the plane. The
display will resize automatically to ensure all data points can be seen.
Viewing the XYZ Position of Data Points
It is possible to view the Part Coordinate XYZ
position of an individual data point. To perform this operation, right click
over the data point symbol and a popup box will appear that reports the
position, see figure 2. In this example, we right-clicked while
positioning the mouse pointer over the data point.
 |
| figure 2,
Data Point Information |
There are four viewing modes:
The display of the data while orientating to the calculated plane normal.
This mode is the most common mode and illustrates the high and low areas of
the plane. This view would closely illustrate a plane's flatness.
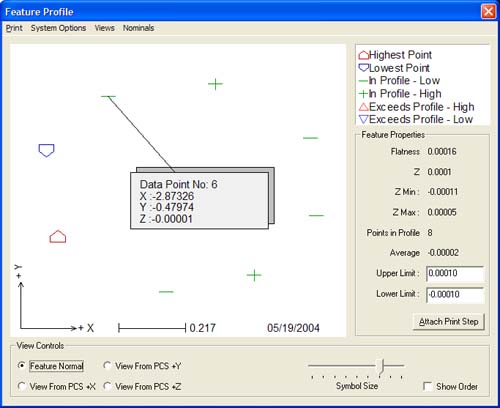
View From PCS +X, +Y and +Z
These views offer
a view that is constrained by the current Part Coordinate System. The
application would closely resemble the location of the data points in a
profile band referenced off the Part Coordinate System, see figure 3.
 |
| figure 3,
Planar Profiler Viewed from the PCS |
Comparing the Views
In figure 1, we have all data points within the
designated profile of +/- 0.0001. This differs from the data point display
in figure 3 where it shows all data points beyond the profile band limit.
In figure 1, we are evaluating the individual data
points directly against the localized area of the plane simulating a dial
indicator moving over the plane with its zero set at a point within the
measured area. Each data point is then compared to that zero point without
regard to the actual reported position on the current Part Coordinate
System. This process is comparable to the inspection technique used to
measure flatness.
in figure 2, we perform a similar test on each data
point also using a dial indicator concept. In this view we set the zero of
the indicator where it crosses the reported axis of the Part Coordinate
System. Then move the indicator over to the individual data points and
record the change in reading. This process would be comparable to the
inspection technique used to measure the profile.
Display Controls
There are basic display controls that change the look
of the data being reported.
Symbol Size
As it describes, this slider will
scale the symbols being displayed for better viewing. Symbol Size is available
in
all views.
Tail
This check box is available only when
viewing from a PCS axis. By placing a check here, the display will show the
profile limits and exaggerated whiskers for each data point.
Tail Length
This slider is available only when
viewing from a PCS axis. This will change the exaggeration of the tails with
regard to the profile limits.
Show Order
When checked, all data points will
be displayed with a number corresponding to the order it was captured during
measurement.
Menu Commands
There are 4 drop down menu titles available in the
Planar Profiler. These control the behavior of the printing and displaying of
data.
Print...
This command prints the current
display on demand.
Page Setup
Used to control the printer
characteristics.
1-Up
Sets the preference for the displayed
feature to print one view per page.
2-Up
Sets the preference for the displayed
feature to print two views per page as defined in the Planar Profiler
setup. This mode is helpful when you want to view the feature normal and
one PCS axis view on a single sheet of paper.
System Options
Set Colors
You can set colors
for the six individual point-type definitions.
Print Heavy Lines
This informs the
profiler to print with 2x heavy lines. This is helpful when printing
from high resolution printers where the printing of a 1 pixel wide line
appears faint or hard to see.
By selecting this option,
all data points will be
printed when a complete inspection report is requested. The printout
will include the deviation distance to the plane and its XYZ location in
the Part Coordinate System.
Views
View 1 - Upper
Choose the view to be
printed in the first position of the 2-Up or 1-Up report.
View 2 - Lower
Choose the view to be
printed in the second position of a 2-Up report.
Nominals
Not activated.
Attach Print Step
The Attach Print Step will append a program step to
your Inspection Report that will print the Planar Profile report during the
execution of the inspection program. Do to the graphical nature of the
report, we suggest these program statements be placed near the bottom of the
inspection report. Most printers will slow down when printing in graphic
mode.
Related Procedures:
Data Point Report,
Plane,
Planar Profile Tutorial
|