Applies to: Geomet 101 w/GeoPlus, Geomet 301, Geomet 501
Last updated:
Saturday January 15, 2011.
The Planar Profile tool is used to examine a measured or
constructed plane graphically to obtain a better understanding of its shape
and form.
Plane Reporting Refresher
A plane that has been measured or constructed is reported
as a perfect entity that contains a direction vector and a series of
projection angles that define it's location within the active coordinate
system.
The direction vector can be imagined as a line the points
out from the plane and is perpendicular to that plane. The length of the
line has a unit equal to 1 unit. In Geomet, the length is 1.00".
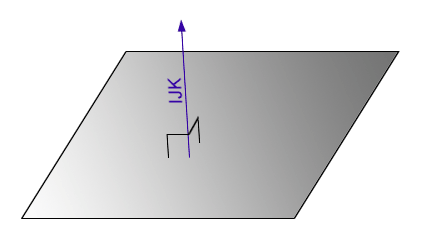
As shown above, we have a direction vector pointing upward
and is labeled "IJK". The easiest description of what the IJK stands for
let's use the example of a plane that lies perfectly in the Part Coordinate
System, XY base plane. The IJK for this plane is 0,0,1. If you imagine
standing above this plane looking down upon it in the - Z direction, you
will notice the IJK is pointing directly at you.
There is no "drift" toward the X or Y-Axes. Therefore the
change in X from the bottom of the IJK to the top of the IJK is 0.0 in the X
direction. The same condition exists for the Y direction. All the change
takes place in the Z direction. This leaves the IJK equal to 0, 0, 1,
The position of this plane is reported on one Part
Coordinate axis. In the above example, the position would be reported as
were it crosses the Z-Axis.
The orientation of the plane is reported as a series of
projection angles using the IJK and its projected angle in each of the three
PCS base planes. Usining the illustration below, we have a plane that is
shown relative to the current PCS.
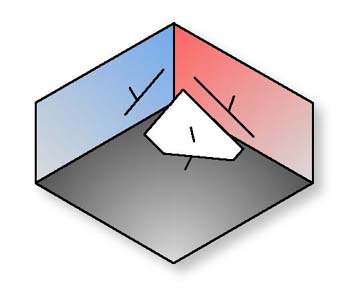
The reported projection angles are illustrated below.
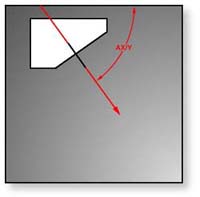 |
 |
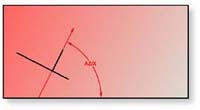 |
| AX/Y Projection |
AY/Z Projection |
AZ/X Projection |
Understanding how a plane is reported will assist in the visualization of
how the Planar Profile tool represents data.Planar Profile Tool
Geomet has an evaluation tool that allows you to look at a
plane and examine form and profile. This tool is applied to an existing
measured or constructed plane, or it can be viewed while capturing data
points on a plane.
To access the Planar Profile Tool, please review the
corresponding help pages that start
here.
Using the Planar Profile
Interactively
A CMM is a discrete point capturing tool that has no
ability to locate the highest and lowest location on a plane. This makes the
CMM a poor choice to determine form conditions such as Flatness.
To overcome this condition, it is always recommended to
captures large data point clouds which increases your chance of locating the
extremes. Some tools such as scanning tools and scanning probes increase
your efficiency of the CMM. One example is the
Plane Generator where you can
setup a row / column scanning grid.
Another method to locate the high and low point extremes
is to use the Planar Profile tool interactively while you are capturing data
points.
Launch the Planar Profile tool then set Geomet up to
measure a plane in the normal way. However, Geomet will see that the Planar
Profile tool is active and will not preset the number of data points
required, but starts with a count-up value of 0. With each data point you
capture on the plane surface, the counter increases.
The Planar Profile tool "listens" for each data point and
displays it in the graphical area as a series of symbols. Once you have
captured 3 data points, the Planar Profile tool will calculate the plane and
populate the tool with the current reported values. Each successive data
will cause the tool to recalculate the reported values and update the
graphic display to show the location of the highest, lowest and relative
position of each data point against the reported values of the plane.
As you add data points, a shape begins to appear that is
easily recognized as a series of '+' and '-' symbols that represent the
highest and lowest areas within the plane. Concentrate additional data pints
around these areas to better define the form of the plane. Quickly you will
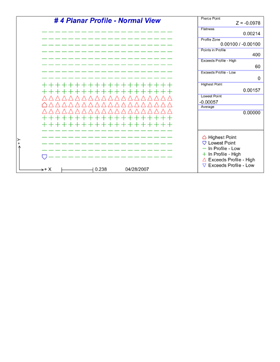
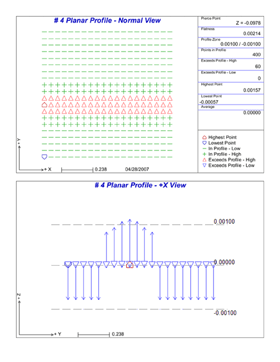
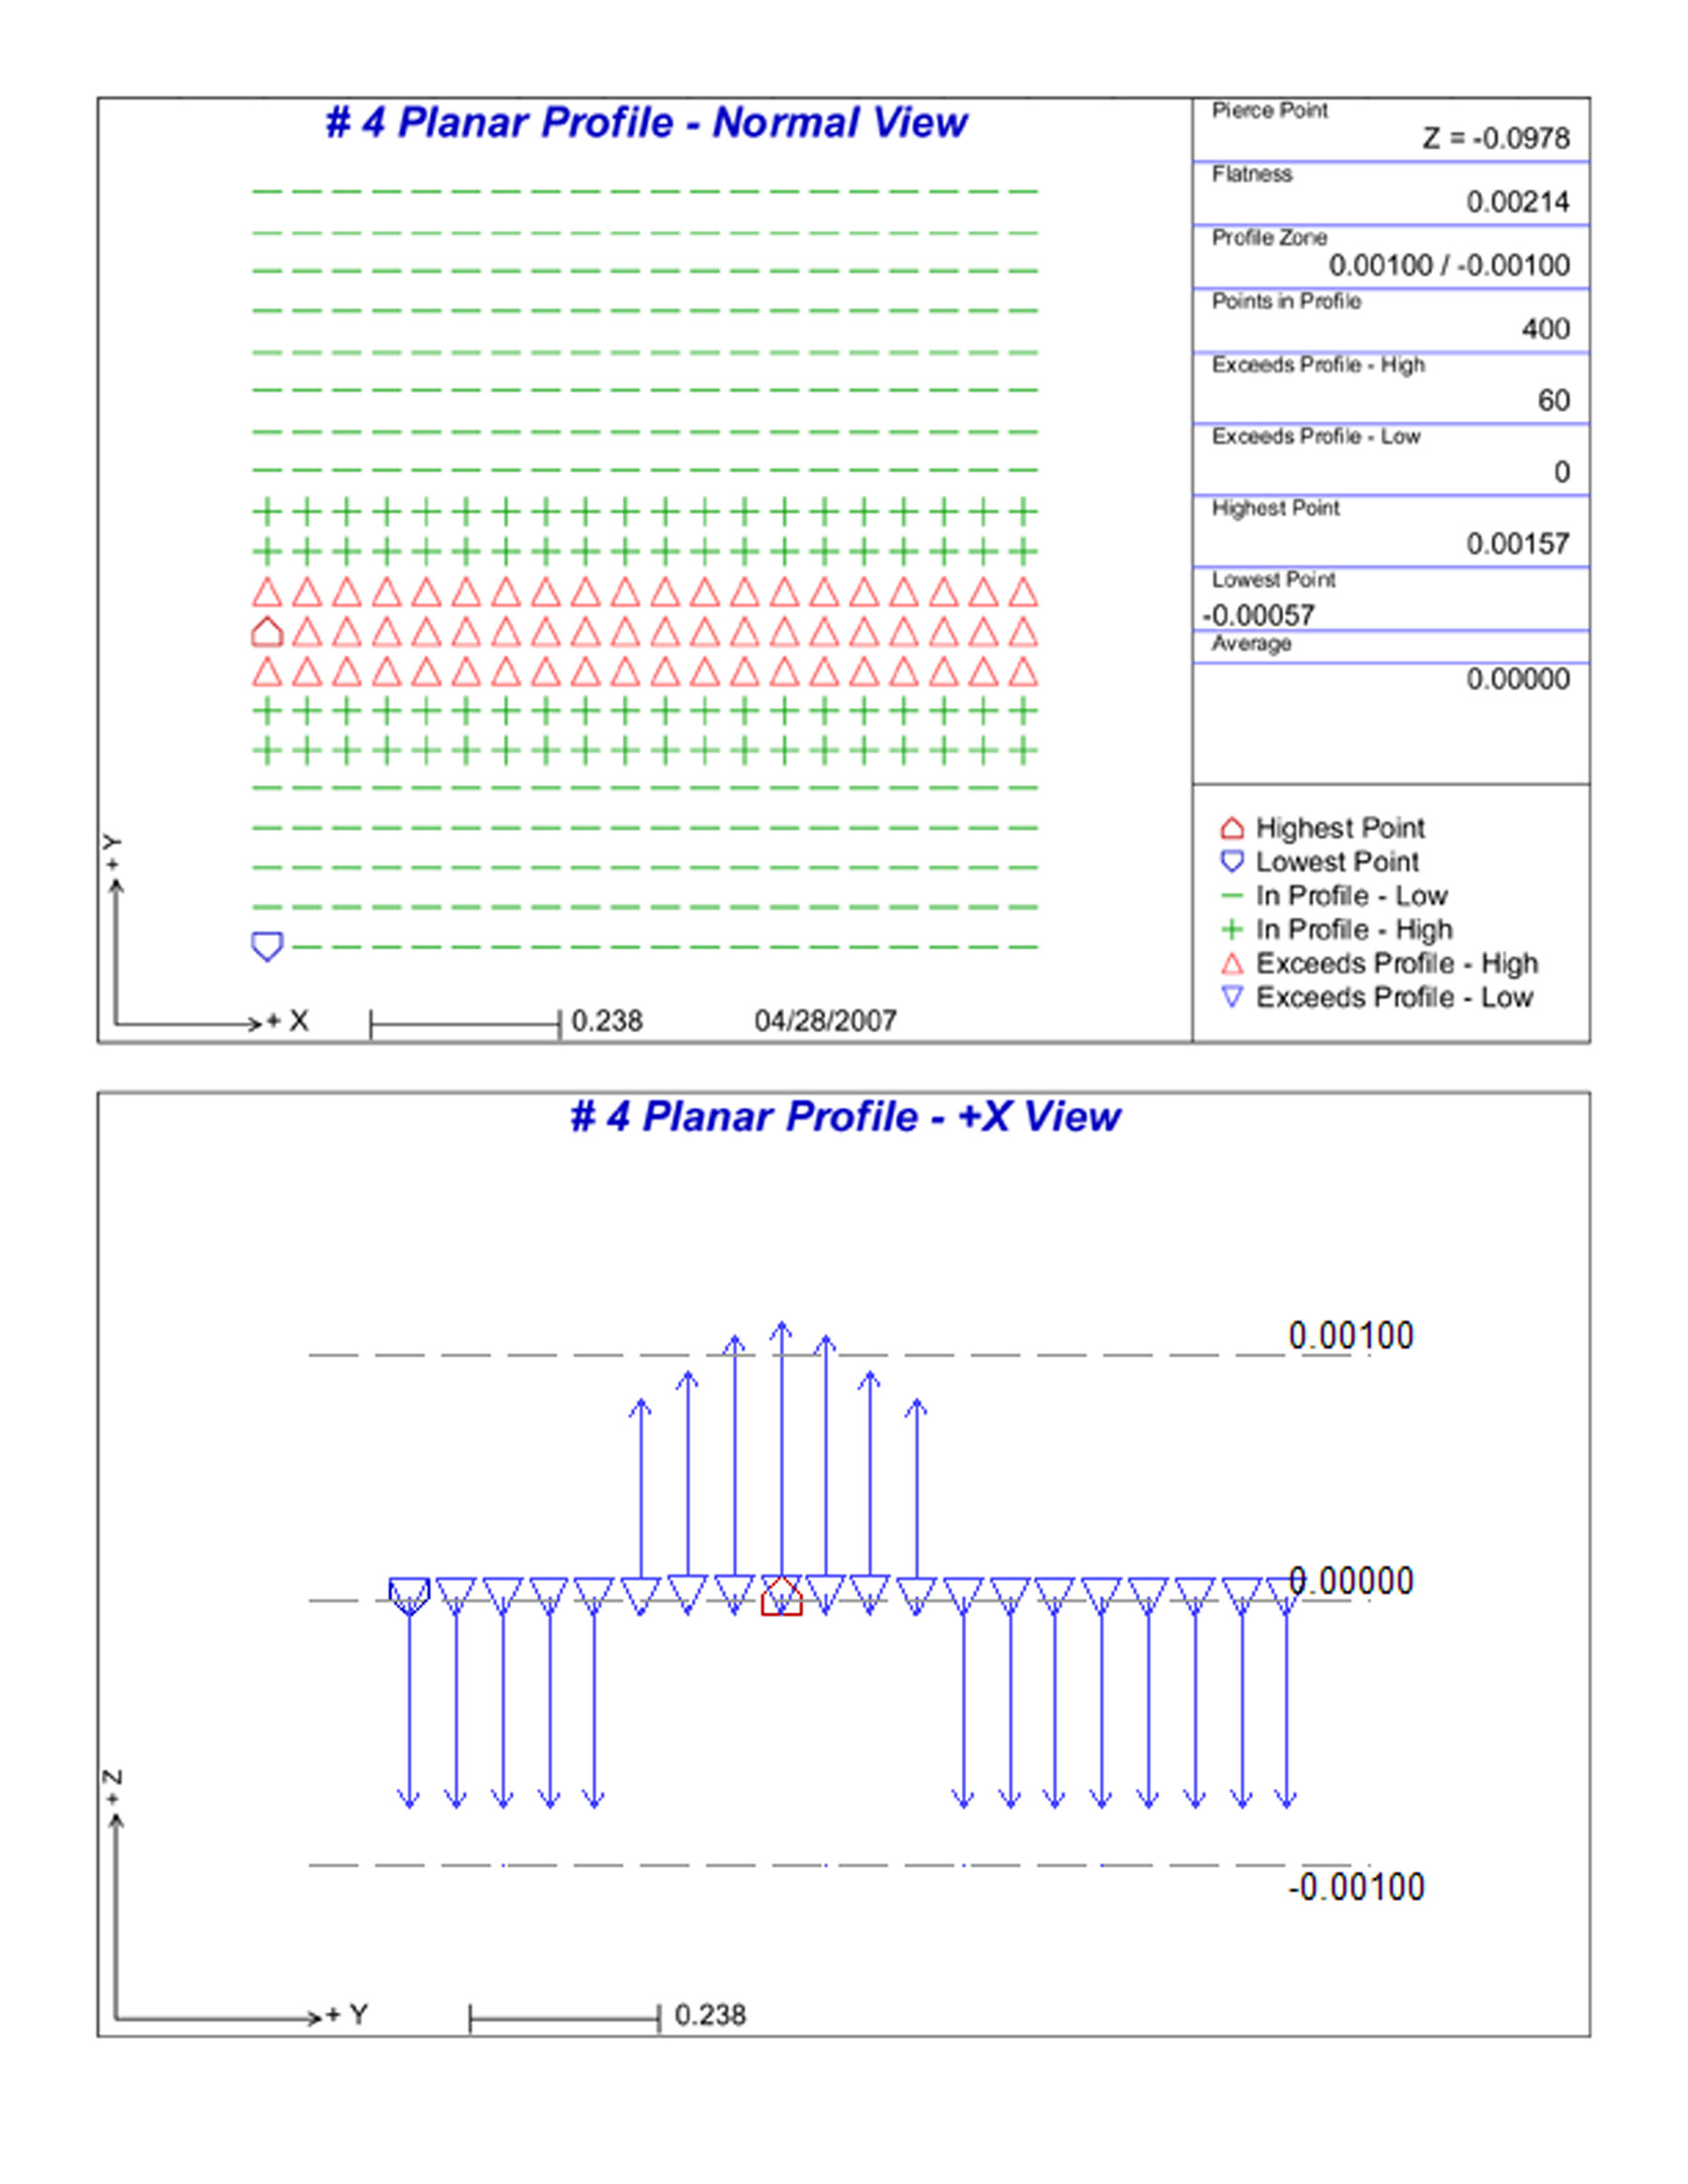
see the surface take shape. In the example below, we see a plane that two
distinct patterns. This plane was captured using the Plane Generator.
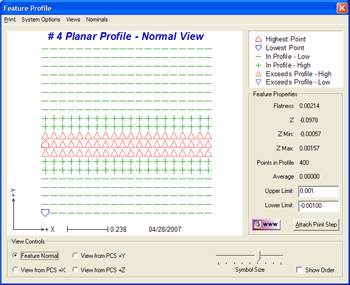
In the example above, we captured 400 data points using
the Plane Generator. This
allowed us to capture uniform data points spread over the entire plane
surface. As we see, there is a uniform raised deviation which is shown by
symbols.
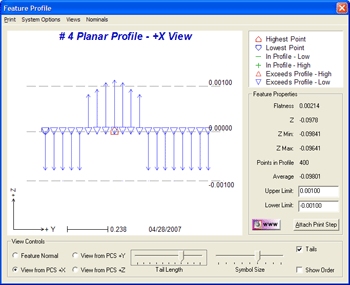
Looking at the plane from its side, we get a better
understanding of how the surface looks. It is clear that there are data
points that exceed the allowable profile zone of +/- 0.001". Although the
tolerance applied to the plane showed its location and projection angle are
within specification, some data points were not.
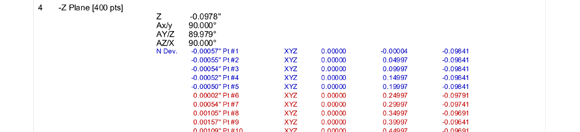
We can extract the individual data points for further
evaluation. This is accomplished by choosing from the drop-down menu {System
Options → Print All Data Points]. This is a flag setting that is attached
only to the selected plane. When the final inspection report is printed, the
individual data points are reported in the current Part Coordinate System
and is probe compensation to the normal vector of the plane.
In a standard Geomet printed report, the Planar Profile is
not included. Printing of the Planar Profile is setup inside the Planar
Profile tool. The printing can be customized to print one view or two as the
examples below illustrate.
 |
 |
| Standard Printout 1-Up |
Standard Printout 2-Up |
To see a larger view of the 2-Up Printout,
click here.


